Introduction to Java Garbage Collection
Overview
Definition
In computer science, garbage collection (GC) is a form of automatic memory management.
The garbage collector attempts to reclaim memory allocated by the program but is no longer referenced (garbage).
image source: (https://www.scaler.com/topics/media/garbage-collection-roots-in-java-1024×413.webp)

Where are the Java Garbage Collectors
The GC implementation lives in the JVM.
image source: https://binarycoders.files.wordpress.com/2021/04/jvm_architecture.png

Runs on the Heap or the Stack?
Garbage Collection runs on the heap memory to free the memory used by objects that do not have any reference.
Garbage
Unreferenced Objects are garbage. We can have garbage:
- By nulling the reference
- By assigning a reference to another
- By anonymous object etc.
Nulling a Reference
Employee e=new Employee();
e=null;
Assigning a Reference to Another
Employee e1=new Employee();
Employee e2=new Employee();
e1=e2;
// Now the first object referred to by 'e1' is available for garbage collection
Create an Anonymous Object
new Employee();Pros and Cons of GC
Pros
- GC frees the programmer from manually deallocating memory.
- GC helps avoid these errors:
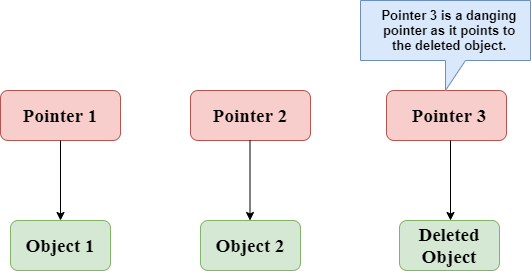
1/3 Dangling pointers occur when a piece of memory is freed while there are still pointers to it, and one of those pointers is dereferenced. By then, the memory may have been reassigned to another use, with unpredictable results.
image source: https://static.javatpoint.com/cpages/images/dangling-pointers-in-c.png
2/3 Double free bugs occur when the program tries to free a region of memory that has already been freed and perhaps already been allocated again.
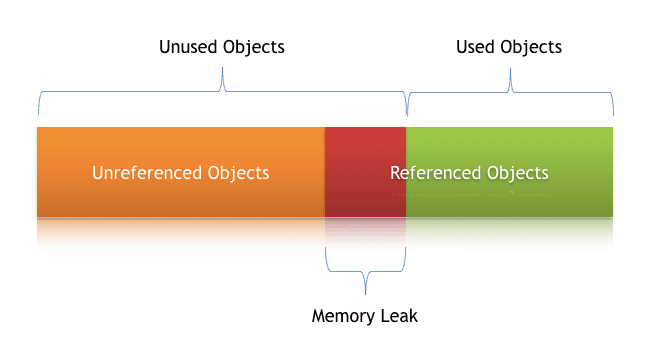
3/3 Some types of memory leaks , in which a program fails to free memory occupied by objects that have become unreachable, which can lead to memory exhaustion.
image source: https://www.baeldung.com/wp-content/uploads/2018/11/Memory-_Leak-_In-_Java.png
Cons
Using Computing Resources – GC uses computing resources and brings some runtime overhead that is out of the programmer’s control. GC could lead to performance problems for large applications.
Stalls – resulting in stalls when the program pauses to shift/free memory – freezes all those active threads during the memory recovery phase.
Unpredictable – The moment the garbage is collected can be unpredictable. Unpredictable stalls can be unacceptable in real-time environments.
Measures of the GC Performance
The two primary measures of garbage collection performance are throughput and pauses.
Two other considerations are footprint and promptness.
Throughput
Throughput is the percentage of the total time spent on other activities apart from GC.
For example, if your throughput is 90%, the application code runs 90% of the time, and garbage collection runs 10% of the time.
You want higher throughput for any high-load business application.
Pauses / Latency
Pauses are times when an application appears unresponsive due to GC.
Latency is the application responsiveness, which garbage collection pauses affect.
In any application interacting with a human or some active process (such as a valve in a factory), you want the lowest possible latency.
Footprint
A footprint is the working size of the JVM process, measured in pages and cache lines.
I.e., Footprint is the amount of memory allocated by a process.
Optimizing footprint means storing fewer things in memory for less time (do not load what you do not need, free memory as soon as possible, i.e., do not keep a reference on no more used variable).
Reducing footprint may come with an additional overhead in CPU or other IO (memory is quick to access much more than file system or network).
You can also reduce the whole java process footprint by limiting the maximum amount of memory allocated (-Xmx JVM option); however, working with less memory will trigger more (more often and longer) garbage collector calls and will so use more CPU).
A good example of footprint reduction would be processing an XML tree using a pull parser (parse the tree chunk by chunk) instead of DOM (load the whole tree in memory to process it)
Promptness
Promptness is the time between when an object becomes dead and when the memory becomes available. Promptness is an important consideration for distributed systems.
Trade-Off of Measures
A particular generation size makes a trade-off between the abovementioned four metrics.
For example, a large young generation likely maximizes throughput but at the cost of footprint and promptness.
Conversely, using a small young generation and incremental GC will minimize pauses and thus increase promptness but decrease throughput.
GC Algorithms – Marking Reachable Objects
The most traditional approaches are tracing and reference counting:
Tracing
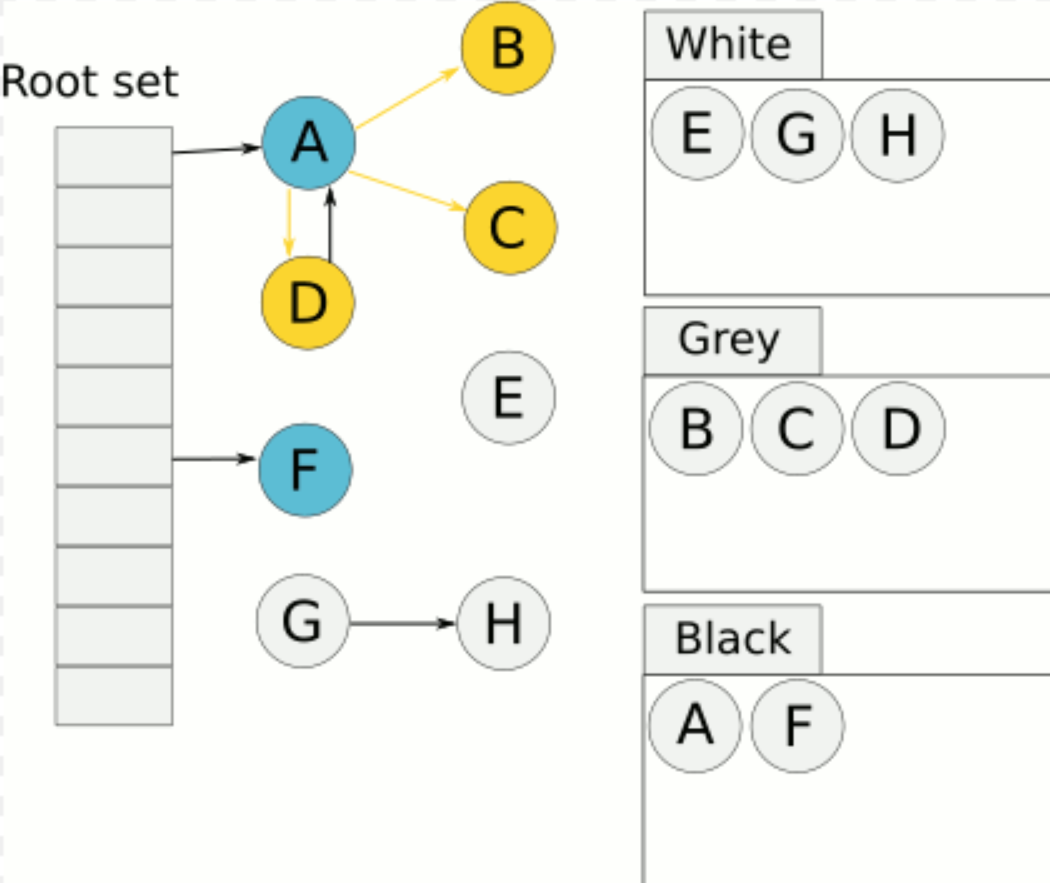
Recursively mark reachability by starting from a set of root memory blocks in use (e.g., pointed to by global or local variables currently in stack frames).
Example: (where E, G, and H will be cleaned up )
image source: https://en.wikipedia.org/wiki/Tracing_garbage_collection
Reference Counting
Count the number of pointers pointing to one particular object by bookkeeping it every time a pointer is created or modified. It frees the object when the counter decreases to zero.
image source: https://plumbr.io/app/uploads/2015/05/Java-GC-counting-references1.png

Tracing vs. Reference Counting
| Tracing | Reference Counting | |
|---|---|---|
| Collection Style | Batch | Incremental |
| Cost Per Mutation | None | High |
| Throughput | High | Low |
| Pause Times | Long | Short |
| Real-Time? | No | Yes |
| Collects Cycles? | Yes | No |
| Starting Point | Roots | Anti-roots |
| Graph Traversal | Fwd. from roots | Fwd. from anti-roots |
| Objects Traversed | Live | Dead |
| Initial RC | Low (0) | High |
| RC Reconstruction | Addition | Subtraction |
| Extra Iteration | Sweep Phase | Trial Deletion |
Java’s Choice
The JVM uses Tracing.
GC Algorithms – Removing Unused Objects
Mark and Sweep
Mark and Sweep – Just remove unused objects

Fragmenting Issue
Whenever sweeping takes place, the JVM has to ensure we can reuse the areas filled with unreachable objects. The unreachable objects would eventually lead to memory fragmentation.
Issues:
- Write operations become more time-consuming as finding the next free block of sufficient size is hard.
- When creating new objects, JVM allocates memory in contiguous blocks. So if fragmentation escalates to a point where no individual free fragment is large enough to accommodate the newly created object, an allocation error occurs.
Solution: Compacting / Copying
Mark-Sweep-Compact
This compacting process relocates all the reachable objects next to each other.
image source: https://plumbr.io/app/uploads/2015/06/GC-mark-sweep-compact.png

Pros and Cons
Pros
Eliminating (or reducing) the fragmentation – after such a compacting operation, new object allocation is again extremely cheap via pointer bumping.
Using such an approach, the location of the free space is always known, and no fragmentation issues are triggered either.
Cons
Causing an increased GC pause duration as we need to copy all objects to a new place and update all references to such objects.
Mark-Copy
Mark and Copy algorithms are very similar to the Mark and Compact as they, too, relocate all live objects. The important difference is that the relocation target is a different memory region as a new home for survivors.
Pros and Cons
Pros
Copying can occur simultaneously with marking during the same phase.
Cons
The need for one more memory region, which should be large enough to accommodate survived objects.

Usage Example
Serial GC – This collection of garbage collectors uses mark-copy for the Young Generation and mark-sweep-compact for the Old Generation.
Minor GC Steps
Step 1: Marking
Marking is where the garbage collector identifies which pieces of memory are in use and which are not.
Scanning can be time-consuming if GC must scan all objects in a system.
image source: https://www.oracle.com/webfolder/technetwork/tutorials/obe/java/gc01/images/gcslides/Slide3

Step 2: Deletion
Normal deletion removes unreferenced objects leaving referenced objects and pointers to free space.

The memory allocator holds references to blocks of free space where a new object can be allocated.
Step 3: Compacting
Moving referenced objects together makes new memory allocation much easier and faster.

Generations
Motivation
Performance Issue
Having to mark and compact all the objects in a JVM is inefficient. As more and more objects are allocated, the list of objects grows, leading to longer garbage collection time.
Most Objects are Short-Lived / Weak Generational Hypothesis
Empirical analysis of applications has shown that most objects are short-lived.
Y axis – the number of bytes allocated
X axis – the number of bytes allocated over time.
Fewer and fewer objects remain allocated over time. Most objects have a very short life, as shown by the higher values on the left side of the graph.

These observations come together in the Weak Generational Hypothesis.
JVM Generation Categories
Based on the Weak Generational Hypothesis, the memory inside the VM is divided into
- Young Generation,
- Old or Tenured Generation
- Permanent Generation / PermGen (Before Java 8) and Metaspace (After Java 8)

Eden
Eden is the region in memory where the objects are typically allocated when created.
Young Generation
Young Generation: Where all new objects are allocated and aged. When Young Generation fills up, this causes a minor garbage collection .
Old Generation
Old Generation: Used to store long surviving objects. Typically, a threshold is set for the young generation object, and when that age is met, the object gets moved to Old Generation.
Eventually, Old Generation needs to be collected. This event is called a major garbage collection .
PermGen (Before Java 8) and Metaspace (After Java 8)
Permanent generation / PermGen – Contains Metadata required by the JVM to describe the classes and methods used in the application.
The JVM
- populates the permanent generation at runtime based on classes in use by the application.
-
stores Java SE library classes and methods here.
The permanent generation is included in a full garbage collection.
As predicting the need for Metadata was a complex and inconvenient exercise, JVM removed the Permanent Generation in Java 8 in favor of the Metaspace.

The Generational GC Process
Step 1: Create Objects
First, any new objects are allocated to the Eden space. Both survivor spaces start empty.

Step 2: Trigger Minor GC
When the Eden space fills up, a minor garbage collection is triggered.

Step 3: Move Objects to the Survivor Space
Next to the Eden space reside two Survivor spaces called from and to. It is important to notice that one of the two Survivor spaces is always empty.
Referenced objects are moved to the first survivor space. Unreferenced objects are deleted when the Eden space is cleared.

The same thing happens at the next minor GC for the Eden space.
Unreferenced objects are deleted.
Referenced objects are moved to a survivor space (S1).
Step 4: Objects Aging
In addition, objects from the last minor GC on the first survivor space (S0) have their age incremented and get moved to S1. Once all surviving objects have been moved to S1, both S0 and Eden are cleared.
Notice that we now have differently aged objects in the survivor space.

At the next minor GC, the same process repeats. However, this time the survivor spaces switch. Referenced objects are moved to S0. Surviving objects are aged. Eden and S1 are cleared.

Step 5: Promotion
After a minor GC, when aged objects reach a certain age threshold (8 in this example), they are promoted from the young to the old.

As minor GCs continue to occur, objects will continue to be promoted to the old generation’s space.

So that covers the entire process with Young Generation. Eventually, JVM will perform a major GC on Old Generation, which cleans up and compacts that space.
Generational GC Process Summary

Minor GC vs. Major GC vs. Full GC
It should be noted that there are no formal definitions for those terms – neither in the JVM specification nor in the Garbage Collection research papers.
By convention:
- Full garbage clean the entire Heap – both Young and Old spaces.
- Major garbage collection works on the Old space.
- Minor garbage collection works on the Eden space.
GC Observations
Logging
JVM diagnostic output will display information on pauses due to garbage collection.
If you start the server in verbose mode
–verbose domain
Then the command line argument -verbose:gc prints information for every collection.
Major / Minor
We can identify the major and minor garbage collections based on the output.
If XX enables the garbage collection logging:PrintGCDetails or verbose:GC, the minor collection prints "GC", whereas the major collection prints "Full GC".
Example
Here is an example of an output of the information generated with this JVM flag:
// Log of minor collections
[GC 50650K->21808K(76868K), 0.0478645 secs]
[GC 51197K->22305K(76868K), 0.0478645 secs]
[GC 52293K->23867K(76868K), 0.0478645 secs]
// Log of the major collection
[Full GC 52970K->1690K(76868K), 0.54789968 secs]
On each line,
- the first number: combined size of live objects before GC
- the second number: the size of live objects after GC
- the number in parenthesis: the total available space, which is the total heap minus one of the survivor spaces.
- the final figure is the amount of time that the GC took.
This example shows three minor collections and one major collection.
In the first GC, 50650 KB of objects existed before and 21808 KB of objects after collection. The changing of size means that 28842 KB of objects were dead and collected.
The total heap size is 76868 KB. The collection process required 0.0478645 seconds.
VisualVM
We can observe GC collection in Java VisualVM (see Oracle’s official doc – Performing Your Observations )

Java Garbage Collector Categories
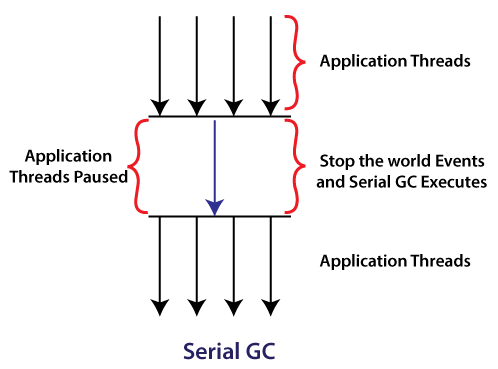
The Serial Garbage Collector
Definition
Both minor and major garbage collections are done serially (using a single virtual CPU).
It is the default for client-style machines in Java SE 5 and 6.
Clean Up Algorithm
Young Generation: mark-copy
Old Generation: mark-sweep-compact
Serialization
It uses the only thread for garbage collection.
It works by holding all the threads of an application. It means that threads of the application freeze by the serial garbage collector during the garbage collection process, and the process is known as stop the world event.
Usage Cases
Serial Garbage collector is well-matched for
- single-threaded environments.
- where many JVMs are run on the same machine (in some cases, more JVMs than available processors). In such environments, when a JVM does a garbage collection, it is better to use only one processor to minimize the interference on the remaining JVMs, even if the garbage collection might last longer. Furthermore, the Serial GC fits this trade-off nicely.
- We need Serial GC to return the proliferation of embedded hardware with minimal memory and cores.
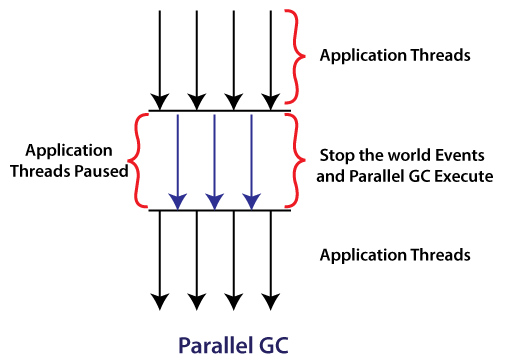
The Parallel Garbage Collector
Definition
The parallel garbage collector uses multiple threads to perform the Young Generation garbage collection. By default, on a host with N CPUs, the parallel garbage collector uses N garbage collector threads in the collection.
Clean Up Algorithm
Young Generation: mark-copy
Old Generation: mark-sweep-compact
Stop the World
Young and Old collections trigger stop-the-world events, stopping all application threads from performing garbage collection.
Parallelization
- During collection, all cores clean the garbage in parallel, resulting in shorter pauses
- Between garbage collection cycles, neither of the collectors is consuming any resources
Usage Cases
The Parallel Garbage Collector is usually used on multi-core machines when your primary goal is to increase throughput. Higher throughput is achieved due to more efficient usage of system resources.
Example: printing reports or bills or performing many database queries.
Arg for the Number of Threads
_-XX:ParallelGCThreads=NNN_ . The default value is equal to the number of cores in your machine.
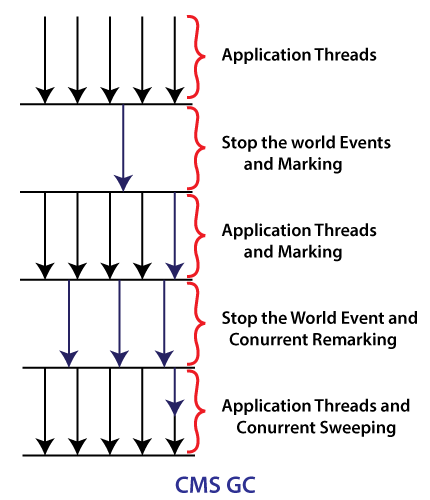
The (Mostly) Concurrent Mark Sweep (CMS) Garbage Collector
Definition
The Concurrent Mark Sweep (CMS) collector collects the tenured generation. It attempts to minimize the pauses due to garbage collection by doing most garbage collection work concurrently with the application threads.
- Normally, the concurrent low pause collector does not copy or compact the live objects.
- Garbage collection is done without moving the live objects.
- If fragmentation becomes a problem, allocate a larger heap.
Note: CMS collector on the young generation uses the same algorithm as the parallel collector.
Note: The official name for this collection of garbage collectors is “Mostly Concurrent Mark and Sweep Garbage Collector.”
Concurrency vs. Parallelism
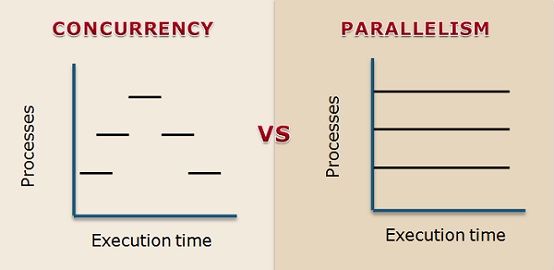
Motivation
The CMS was designed to avoid long pauses while collecting in the Old Generation.
- it does not compact the Old Generation but uses free lists to manage reclaimed space.
- it does most of the job in the mark-and-sweep phases concurrently with the application.
This means that garbage collection is not explicitly stopping the application threads from performing these phases. It should be noted, however, that it still competes for CPU time with the application threads.
By default, the number of threads used by this GC algorithm equals ¼ of the number of physical cores of your machine.
Clean Up Algorithm
Young Generation: mark-copy
Old Generation: mark-sweep-compact
Usage Cases
We can use the CMS collector for applications requiring low pause times and share resources with the garbage collector.
Examples include desktop UI applications that respond to events, a web server responding to requests, or a database responding to queries.
The Garbage First (G1) Garbage Collector
Definition
The Garbage First or G1 garbage collector is available in Java 7 and is designed to be the long-term replacement for the CMS collector.
The G1 collector is a parallel, concurrent, and incrementally compacting low-pause garbage collector with quite a different layout from the previous garbage collectors.
Design
One of the key design goals of G1 was to make the duration and distribution of stop-the-world pauses due to garbage collection predictable and configurable.
- The heap can be split into contiguous Young and Old generations. Instead, the heap is split into a number (typically about 2048) of smaller heap regions that can house objects. Each region may be an Eden region, a Survivor region, or an Old region. The logical union of all Eden and Survivor regions is the Young Generation, and all the Old regions put together is the Old Generation:
- It estimates the amount of live data that each region contains. This is used in building the collection set: the regions that contain the most garbage are collected first. Hence the name: garbage-first collection.

Usage
The G1 collector can achieve high throughput and low latency for applications that meet one or more of the following criteria:
- Large heap size: More than 6GB where live objects occupy more than 50%.
- Rates of allocation and promotion between garbage collection generations may vary significantly during the application’s run.
- A large amount of fragmentation in a heap.
- The need to limit pauses to a few hundred milliseconds.
GC in Java
C vs. Java
C / C++: allocating and deallocating memory is a manual process
Java: the garbage collector handles the process of deallocating memory automatically.
Why is the GC Necessary in Java?
In programming languages such as C and C++, the developer programmatically reclaims the space allocated to an object in the memory.
In Java programming, the user is not responsible for managing the space memory used by the objects.
In JVM, a garbage collection routine is added as its part, responsible for identifying and deleting objects that are no longer in use in memory.
GC Methods
The #finalize() Method
The garbage collector calls the #finalize() method before collecting any object that is eligible for the garbage collector. The finalize() method is used to get the last chance to object to cleaning and freeing remaining resources.
This method is defined in the Object class as:
protected void finalize(){}The #gc() Method
The gc() method invokes the garbage collector to perform cleanup processing. The gc() is found in the System and Runtime classes.
public static void gc(){}The Daemon Thread GC
Garbage collection is performed by a daemon thread called Garbage Collector(GC). This thread calls the finalize() method before the object is garbage collected.
*Daemon Thread: A daemon thread is a thread that does not prevent the JVM from exiting when the program finishes, but the thread is still running.
The Java Keyword new
The Garbage collector of JVM collects only those objects created by the new keyword.
So if you have created any object without new, you can use the finalize method to perform cleanup processing (destroying remaining objects).
Can We Force the GC to Run at Any Time?
No, we cannot force Garbage collection in Java. Although, we can request it by calling the system.GC() or its cousin Runtime.get runtime().get(). It is not guaranteed that GC will run immediately as a result of calling these methods.
Finalization and garbage collection are not guaranteed.
Garbage Collector Cheat Sheet
| Young | Tenured | JVM options |
|---|---|---|
| Incremental | Incremental | -Xincgc |
| Serial | Serial | -XX:+UseSerialGC |
| Parallel Scavenge | Serial | -XX:+UseParallelGC -XX:-UseParallelOldGC |
| Parallel New | Serial | N/A |
| Serial | Parallel Old | N/A |
| Parallel Scavenge | Parallel Old | -XX:+UseParallelGC -XX:+UseParallelOldGC |
| Parallel New | Parallel Old | N/A |
| Serial | CMS | -XX:-UseParNewGC -XX:+UseConcMarkSweepGC |
| Parallel Scavenge | CMS | N/A |
| Parallel New | CMS | -XX:+UseParNewGC -XX:+UseConcMarkSweepGC |
| G1 | -XX:+UseG1GC |
Java Cmdline Args for Heap Sizes
-Xms
Sets the initial heap size for when the JVM starts.
-Xmx
Sets the maximum heap size.
-Xmn
Sets the size of the Young Generation.
-XX:PermSize
Sets the starting size of the Permanent Generation.
-XX:MaxPermSize
Sets the maximum size of the Permanent Generation
GC Code Example
public class TestGarbage1{
    public void finalize(){System.out.println("The object is garbage collected.");}
    public static void main(String args[]){
        TestGarbage1 s1=new TestGarbage1();
        TestGarbage1 s2=new TestGarbage1();
        s1=null;
        s2=null;
        System.gc();
    }
}
Result
The object is garbage collected.
The object is garbage collected.
OutOfMemoryError: GC overhead limit exceeded.
The java.lang.OutOfMemoryError: GC overhead limit exceeded error is displayed when your application has exhausted all the available memory and GC has repeatedly failed to clean it.
Why
The java.lang.OutOfMemoryError: GC overhead limit exceeded error is the JVM’s way of signaling that your application spends too much time collecting garbage with too little result. By default, the JVM is configured to throw this error if it spends more than 98% of the total time doing GC and when after the GC, only less than 2% of the heap is recovered.
image source: https://plumbr.io/app/uploads/2014/04/OOM-example-schema3.png

What Would Happen
Note that the java.lang.OutOfMemoryError: GC overhead limit exceeded error is only thrown when 2% of the memory is freed after several GC cycles
This error means that the small amount of heap the GC can clean will likely be quickly filled again, forcing the GC to restart the cleaning process again. This error forms a vicious cycle where the CPU is 100% busy with GC, and JVM can do no actual work. End users of the application face extreme slowdowns – operations normally complete in milliseconds take minutes to finish.
Example
In the following example, we create a “GC overhead limit exceeded” error by initializing a Map and adding key-value pairs into the map in an unterminated loop:
class Wrapper {
    public static void main(String args[]) throws Exception {
        Map map = System.getProperties();
        Random r = new Random();
        while (true) {
            map.put(r.nextInt(), "value");
        }
    }
}
Solution
The Bad Solution
Adding the following to disable the error check
-XX:-UseGCOverheadLimitIt will only result in another kind of error message, i.e., heap related.
Good Solutions
Option 1: Optimize your code to use less memory and/or reuse objects instead of creating new ones, thus reducing the number of times the garbage collector runs. If you create many temporary objects (e.g., in a loop), you should try to reuse them.
Option 2: Increase heap size using Xmx switch, e.g., Xmx512m (you can help find the correct value by connecting your JVM with JXM and Jconsole).
Option 3: Add -XX:+HeapDumpOnOutOfMemoryError to JAVA_OPTS and analyze the dump with IBM Memory Analyzer (part of IBM Support Assistant Workbench), looking for memory leaks (see references).
Option 4: Try different GC types: Like changing the Garbage Collector Policy with -XX:+UseConcMarkSweepGC concurrent (low pause time) garbage collector (also known as CMS) or -XX:+UseParallelGC parallel (throughput) garbage collector.
References
Java Garbage Collection Basics. (2022). Retrieved 4 October 2022, from https://www.oracle.com/webfolder/technetwork/tutorials/obe/java/gc01/index.html
Garbage collection (computer science) – Wikipedia. (2014). Retrieved 4 October 2022, from https://en.wikipedia.org/wiki/Garbage_collection_(computer_science)
Java Garbage Collection – javatpoint. (2022). Retrieved 4 October 2022, from https://www.javatpoint.com/Garbage-Collection
A Unified Theory of Garbage Collection. (2019). Retrieved 4 October 2022, from https://www.cs.cornell.edu/courses/cs6120/2019fa/blog/unified-theory-gc/
Reference Counting | Plumbr – User Experience & Application Performance Monitoring. (2015). Retrieved 4 October 2022, from https://plumbr.io/handbook/what-is-garbage-collection/automated-memory-management/reference-counting
GC overhead limit exceeded | Plumbr – User Experience & Application Performance Monitoring. (2014). Retrieved 13 November 2022, from https://plumbr.io/outofmemoryerror/gc-overhead-limit-exceeded
How to choose the best Java garbage collector | Red Hat Developer. (2021). Retrieved 11 November 2022, from https://developers.redhat.com/articles/2021/11/02/how-choose-best-java-garbage-collector#:~:text=Throughput%3A%20The%20percentage%20of%20total,running%205%25%20of%20the%20time.
Stages and levels of Java garbage collection | Red Hat Developer. (2021). Retrieved 11 November 2022, from https://developers.redhat.com/articles/2021/08/20/stages-and-levels-java-garbage-collection#
Java Garbage Collection – javatpoint. (2022). Retrieved 12 November 2022, from https://www.javatpoint.com/Garbage-Collection
Types of Garbage Collector in Java – Javatpoint. (2022). Retrieved 12 November 2022, from https://www.javatpoint.com/types-of-garbage-collector-in-java
Garbage Collection Interview Questions in Java – JavaTpoint. (2022). Retrieved 12 November 2022, from https://www.javatpoint.com/java-garbage-collection-interview-questions
Altvater, A. (2017). What is Java Garbage Collection? Best Practices, Tutorials & More. Retrieved 13 November 2022, from https://stackify.com/what-is-java-garbage-collection/
Garbage-First Garbage Collector. (2022). Retrieved 12 November 2022, from https://docs.oracle.com/javase/9/gctuning/garbage-first-garbage-collector.htm#JSGCT-GUID-F1BE86FA-3EDC-4D4F-BDB4-4B044AD83180
What is java.lang.OutOfMemoryError: GC overhead limit exceeded?. (2022). Retrieved 13 November 2022, from https://www.jvmhost.com/articles/what-is-java-lang-outofmemoryerror-gc-overhead-limit-exceeded/
collection, U., & Bogdan, D. (2018). Understanding footprint measurement in java garbage collection. Retrieved 14 November 2022, from https://stackoverflow.com/questions/48809234/understanding-footprint-measurement-in-java-garbage-collection
Excellent summary, thanks for sharing!
Thanks Fahad!
So thanks for sharing!
But several pictures were unavailable.
eg. https://plumbr.io/app/uploads/2015/06/g1-011.png